The Evaluation of Field of View Width in Stereovision-based Visual Homing: Data repository
D.M. Lyons, B. Barriage, L. Del Signore,
Abstract of the paper
Visual homing is a bioinspired, local navigation technique used to direct a robot to a previously seen location by comparing the image of the original location with the current visual image. Prior work has shown that exploiting depth cues such as image scale or stereo-depth in homing leads to improved homing performance. In this paper, we present a stereovision database methodology for evaluating the performance of visual homing. We have collected six stereovision homing databases, three indoor and three outdoor. Results are presented for these databases to evaluate the effect of FOV on the performance of the Homing with Stereovision (HSV) algorithm. Based on over 350,000 homing trials, we show that, contrary to intuition, a panoramic field of view does not necessarily lead to the best performance and we discuss why this may be the case.Overview of the Data Repository
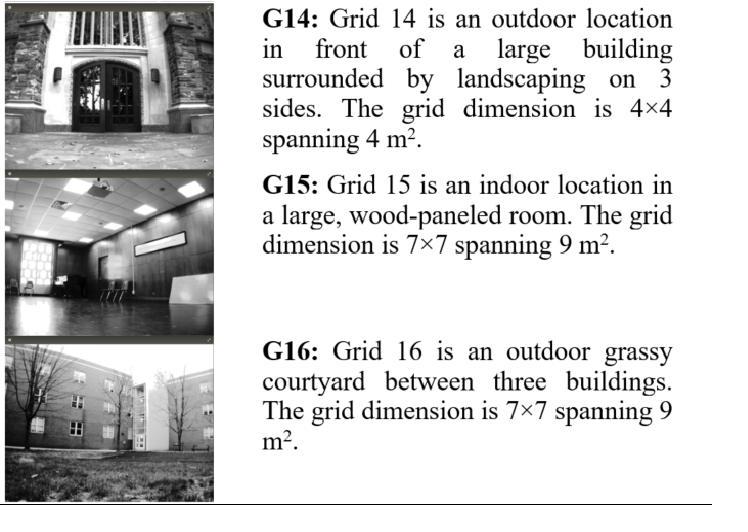
This web page is a repository for six stereovision visual homing database inspired by the panoramic image visual homing databases of Möller and others. Using these databases, we have conducted an evaluation of the effect of FOV on the performance of Nirmal & Lyons's HSV homing algorithm for a variety of visual homing missions in both indoor and outdoor situations totaling over 350,000 visual homing trials. The results indicate that while in general a wide FOV outperforms a narrower FOV, peak performance is not achieved by a panoramic FOV, and we discuss why that may be the case. This web is the data repository for the databases used in the paper. The six databases are briefly overviewed in Table 1 below. The picture to the left on each row is a single representative picture from the database.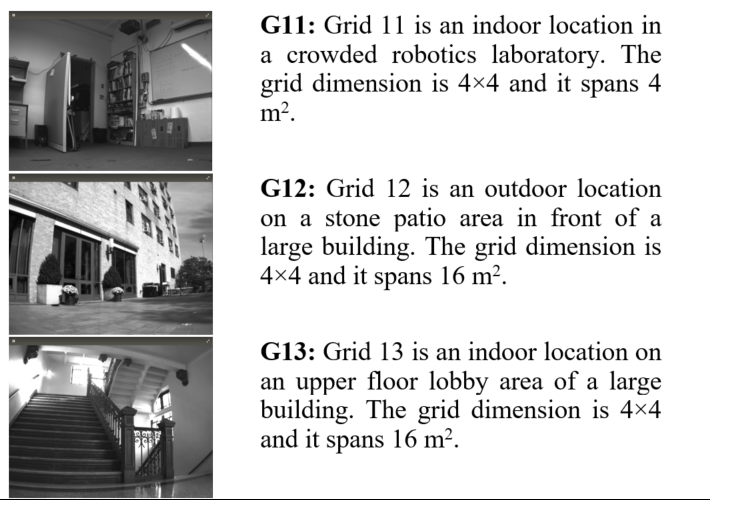
Data Collection Procedure
A spatial grid is superimposed on the area to be recorded, and panoramic visual imagery is collected at each grid cell. The information is used as follows. A robot begins a simulation run with a home position grid cell and a start position grid cell. The visual information the robot receives is the stored imagery for the grid cell it occupies. A motion vector is calculated by comparing this imagery to the home grid cell imagery. This motion may move the robot to another grid cell, and the imagery comparison and motion calculation continues. Homing algorithms different in how these comparisons are done, how the motion vector is calculated, and how termination is decided. The robot used in our visual homing research is a Pioneer 3-AT robot with a Bumblebee2 stereo-camera mounted on a Pan-Tilt (PT) base. The Bumblebee2 with 3.8 mm lens has a 66 deg horizontal FOV for each camera. This limited FOV is one key challenge in building a visual homing database since each grid cell in the database must contain 360 deg of imagery; A robot can arrive at a grid location with any orientation and the simulation should be able to retrieve the imagery for that orientation. This issue is addressed by using the PT base to collect 10 visual and stereo depth images at orientations 36 deg apart, starting at 0 deg with respect to the X axis. The visual image stored is the left image from the stereo pair. The RH coordinate frame has the X axis along the direction in which the robot is facing, the Y pointing left, and is centered on the robot. The final angle requires the robot to be reoriented (in addition to the PT unit motion) due to PT unit pan limits.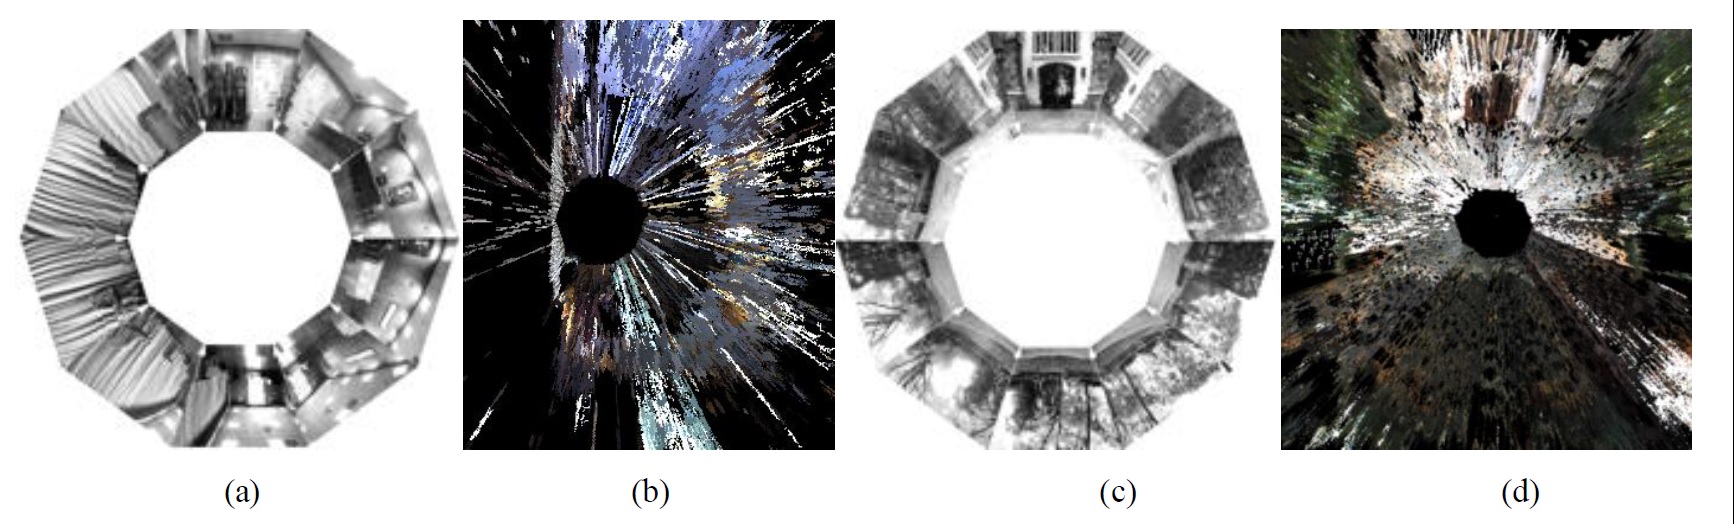
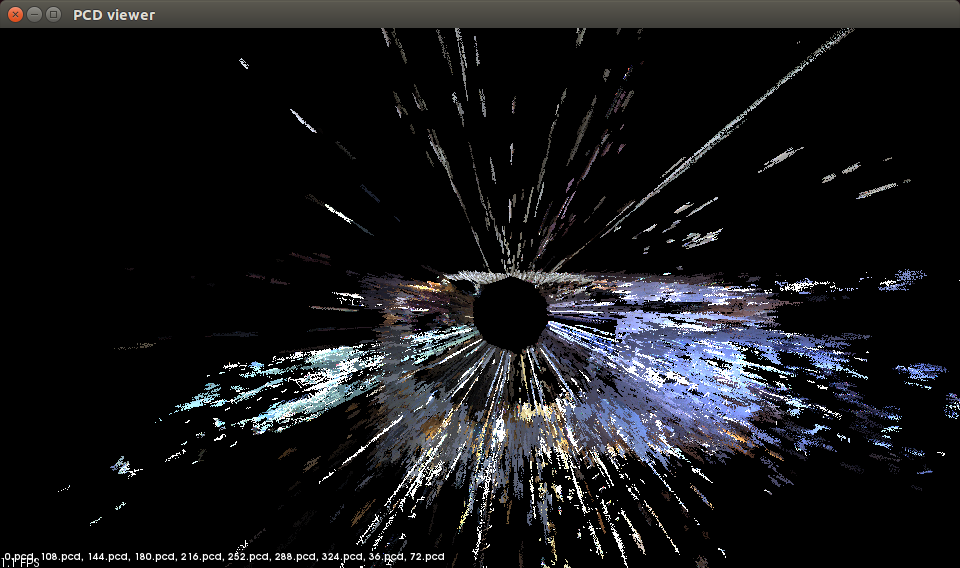
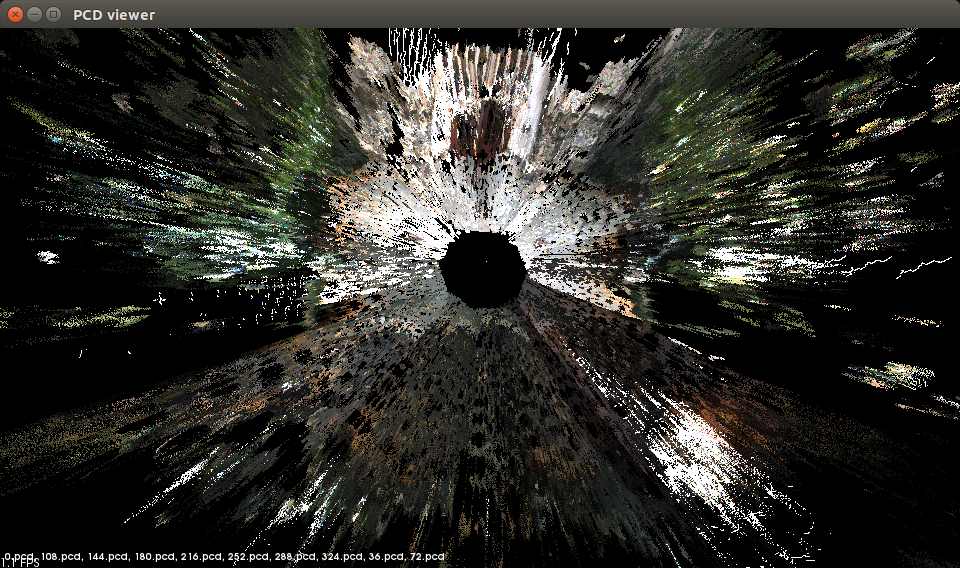
Figure 1: (a, c) Set of visual images (displayed keystone warped only for display purposes) for a single square on the G15 and G14 databases and (b, d) point cloud display of all the stereo depth information from directly overhead (the XY plane) for the same squares, respectively.
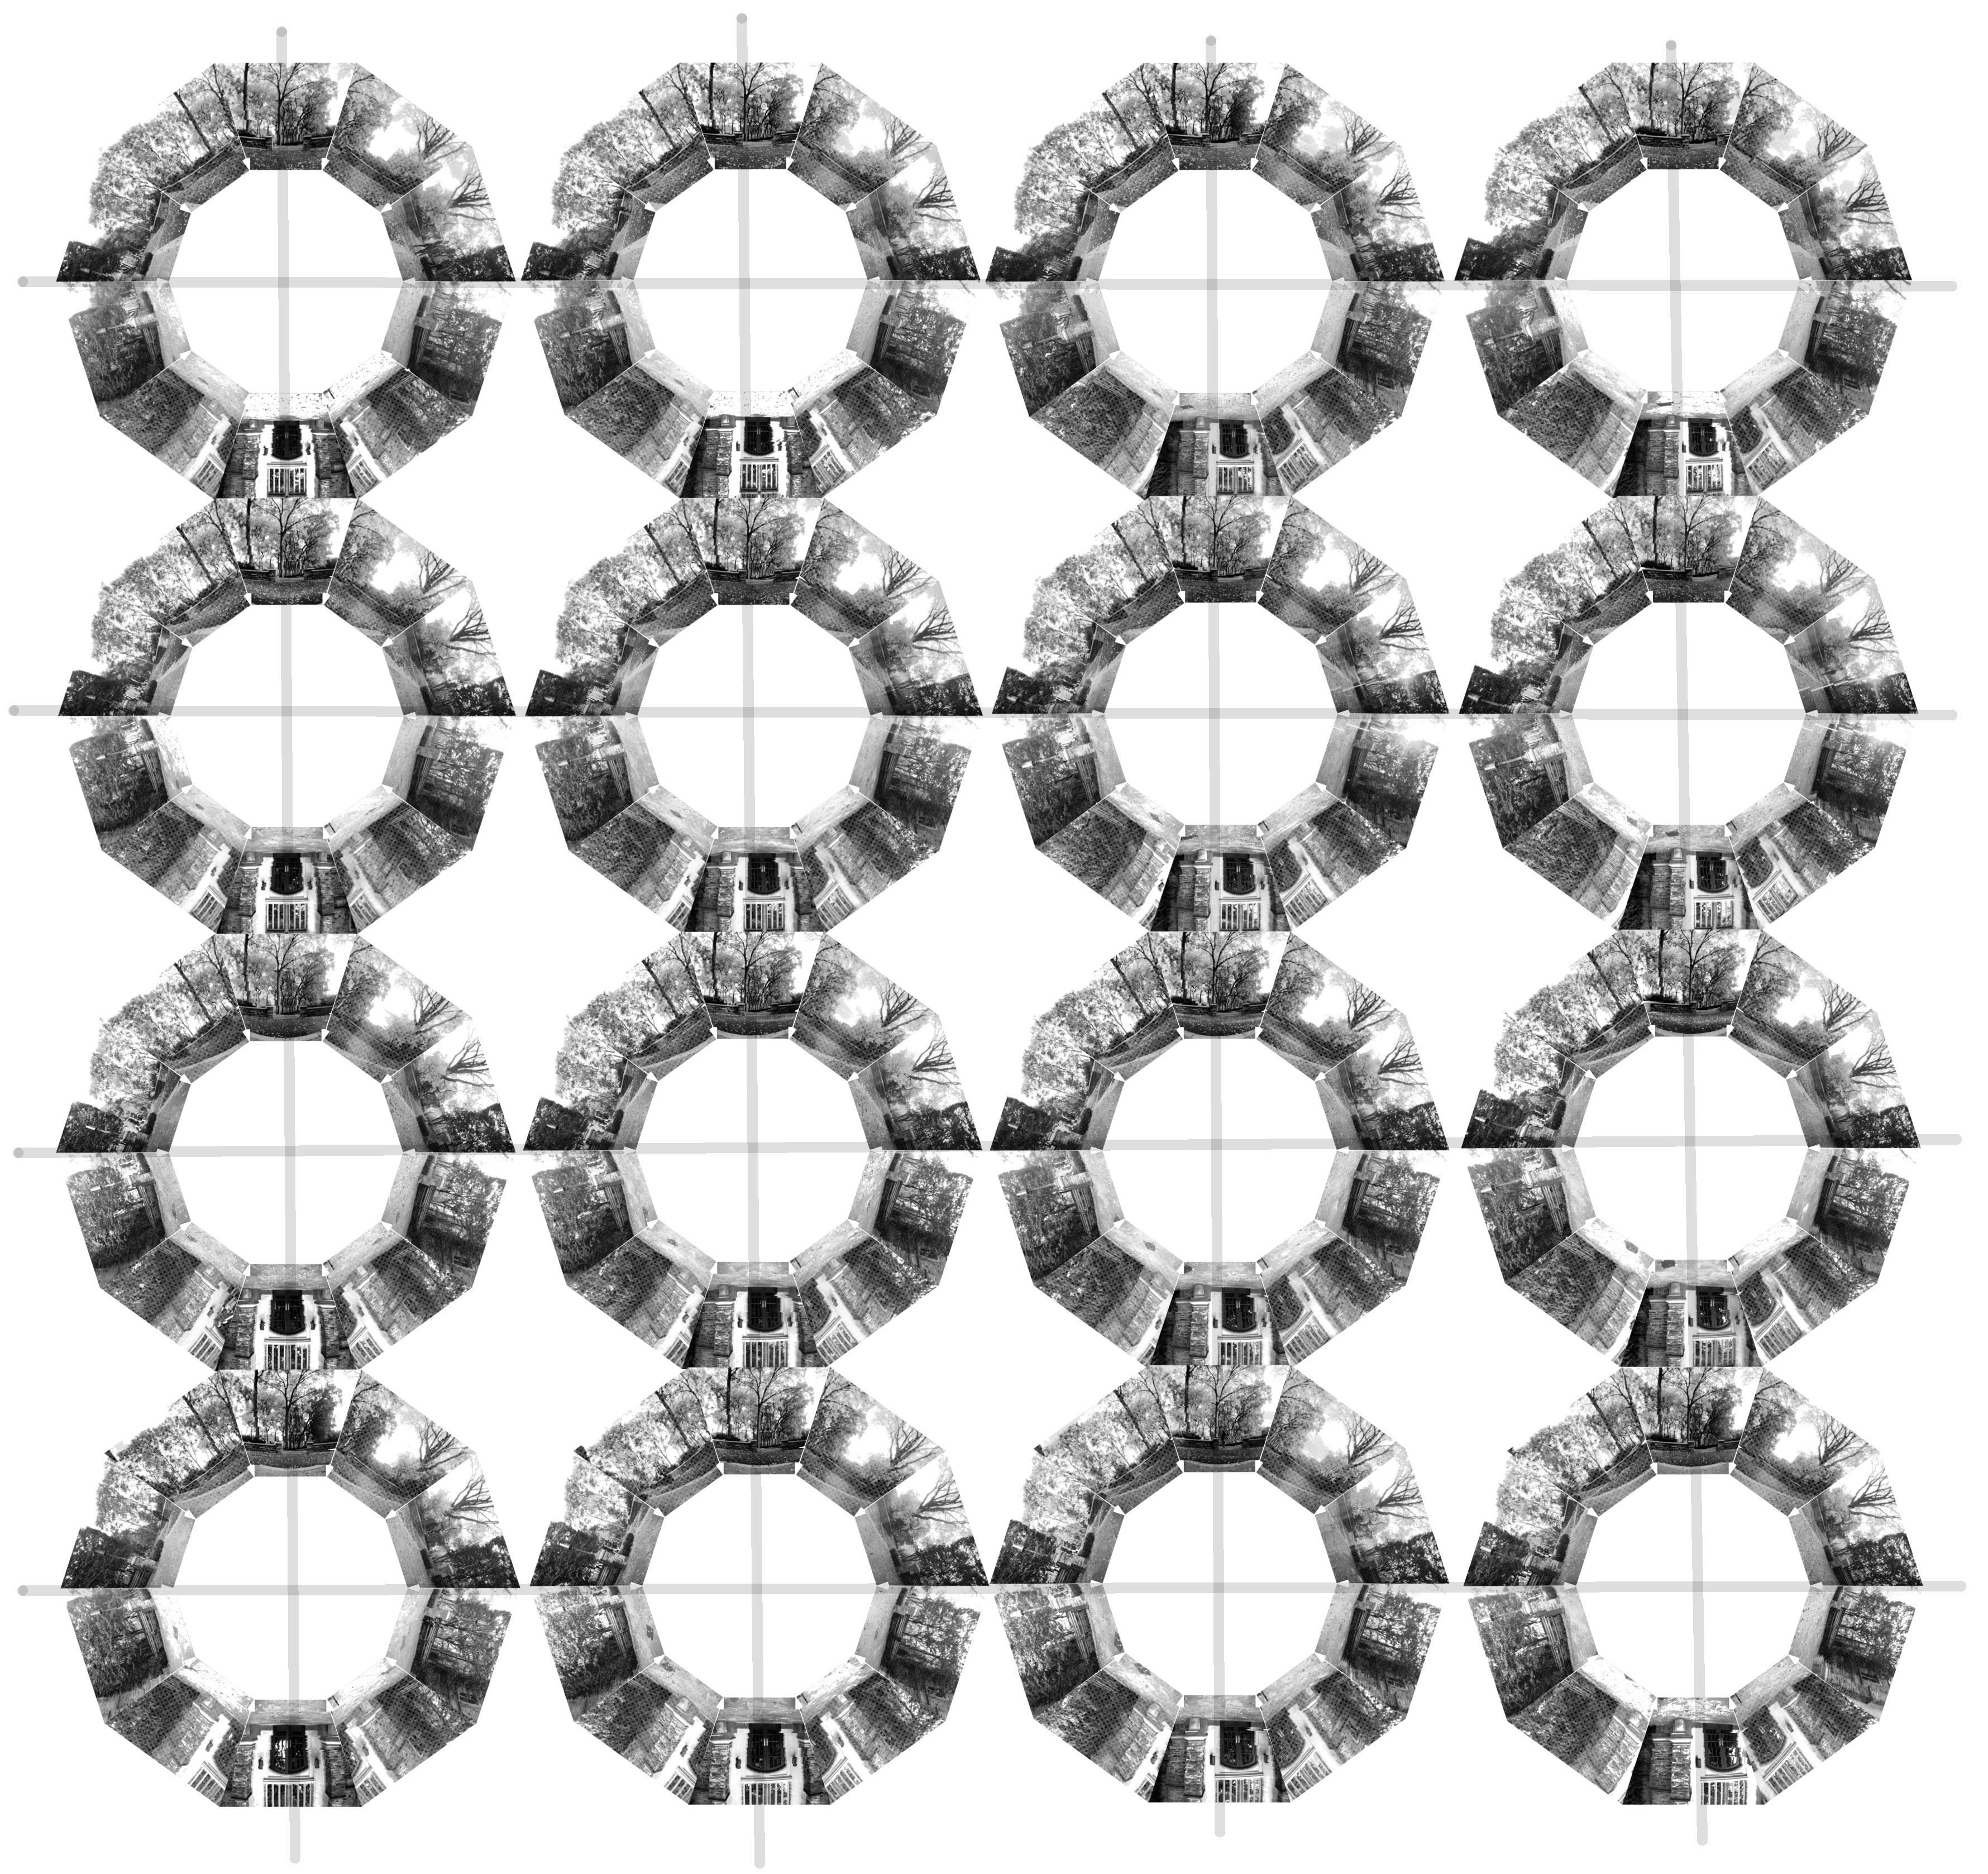
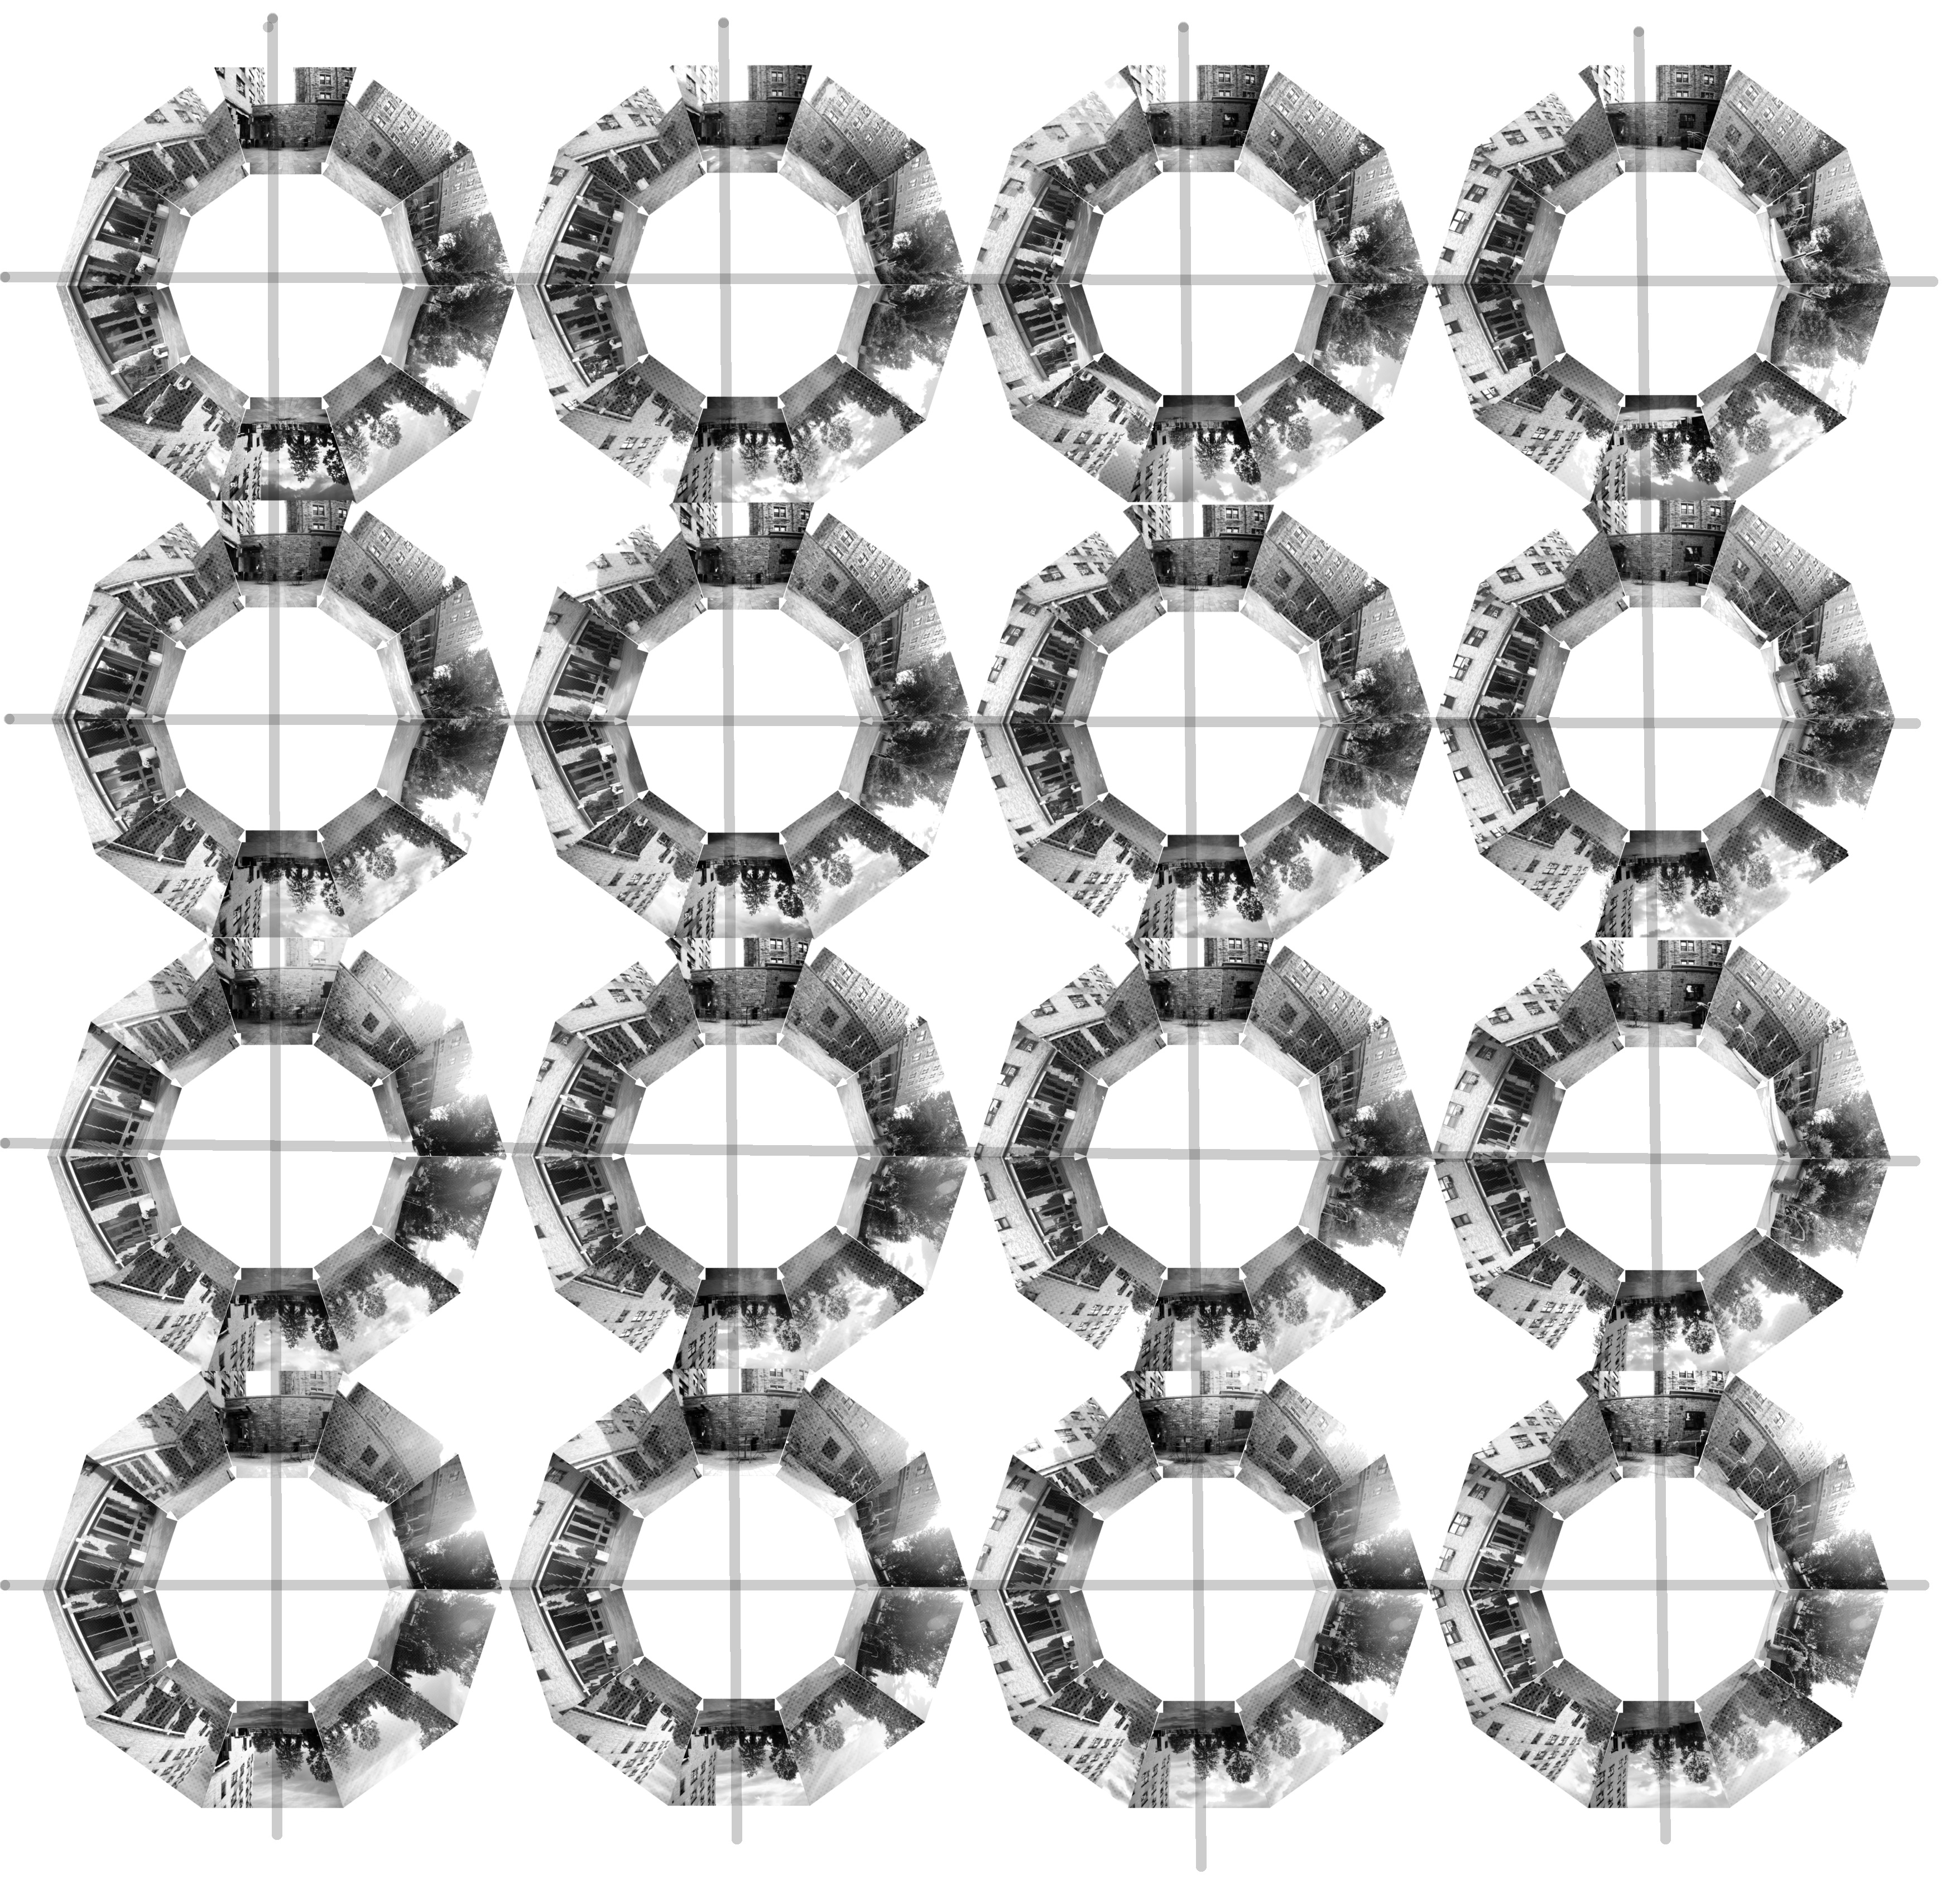
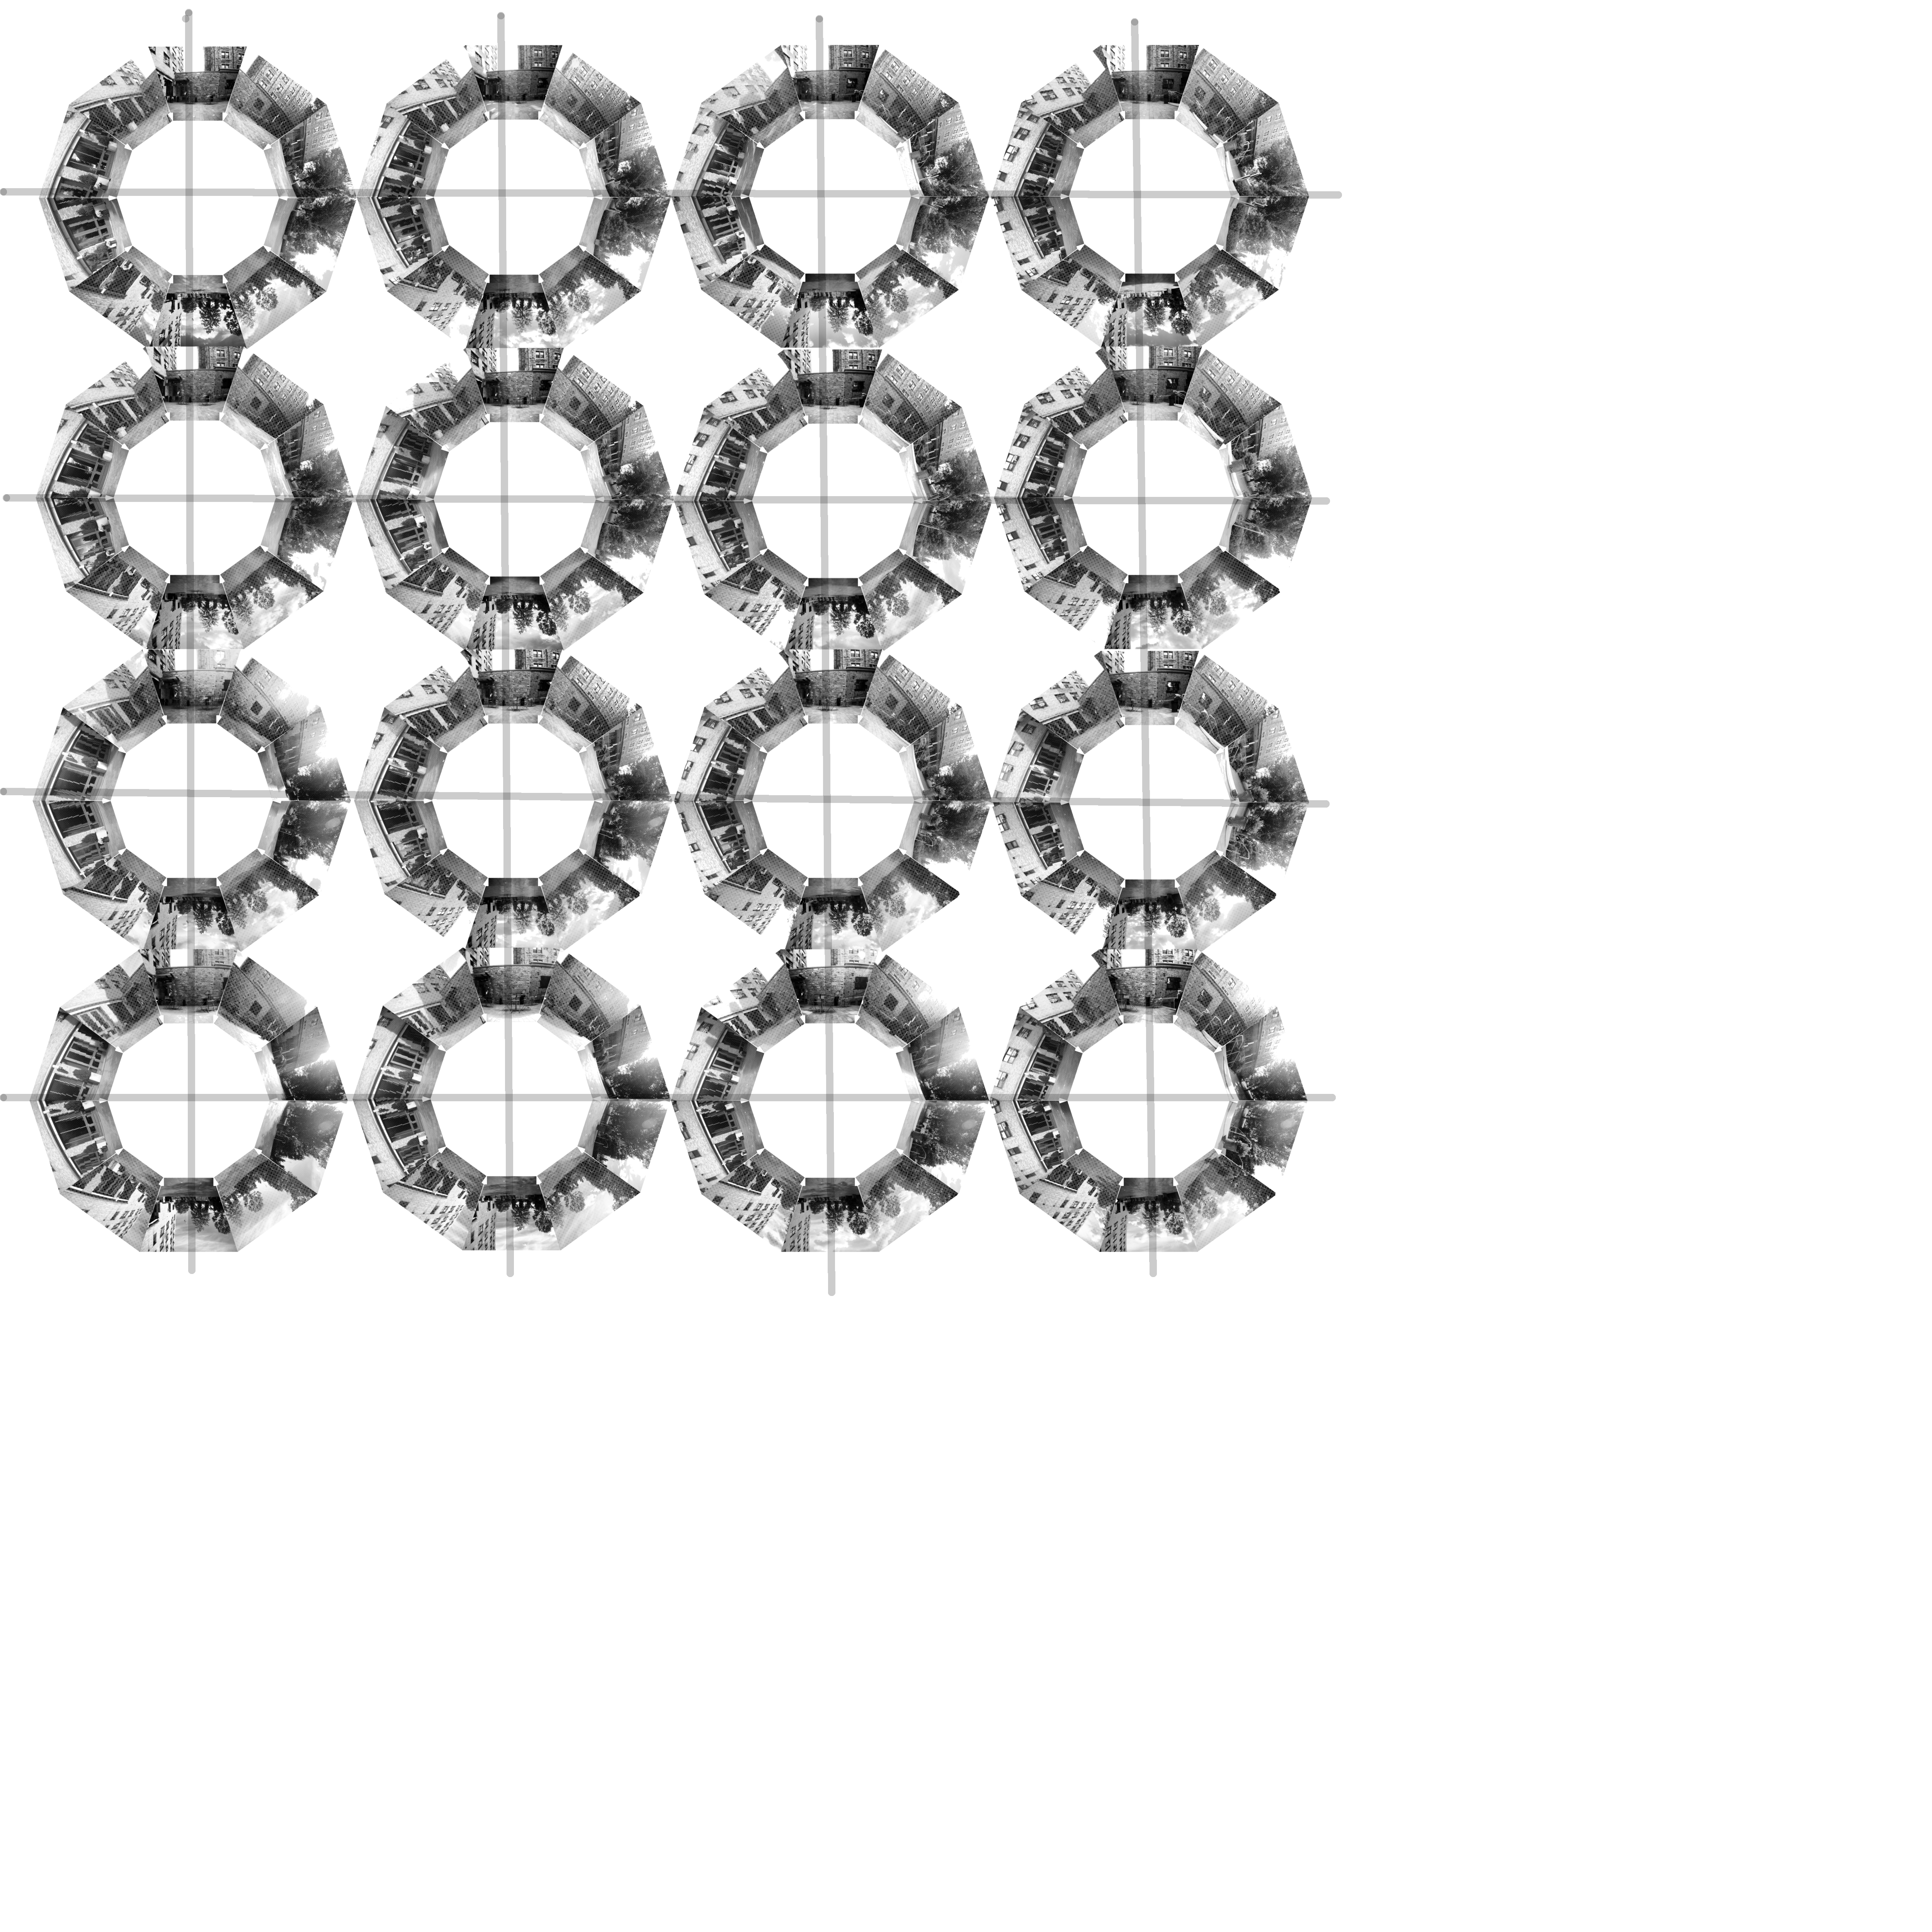
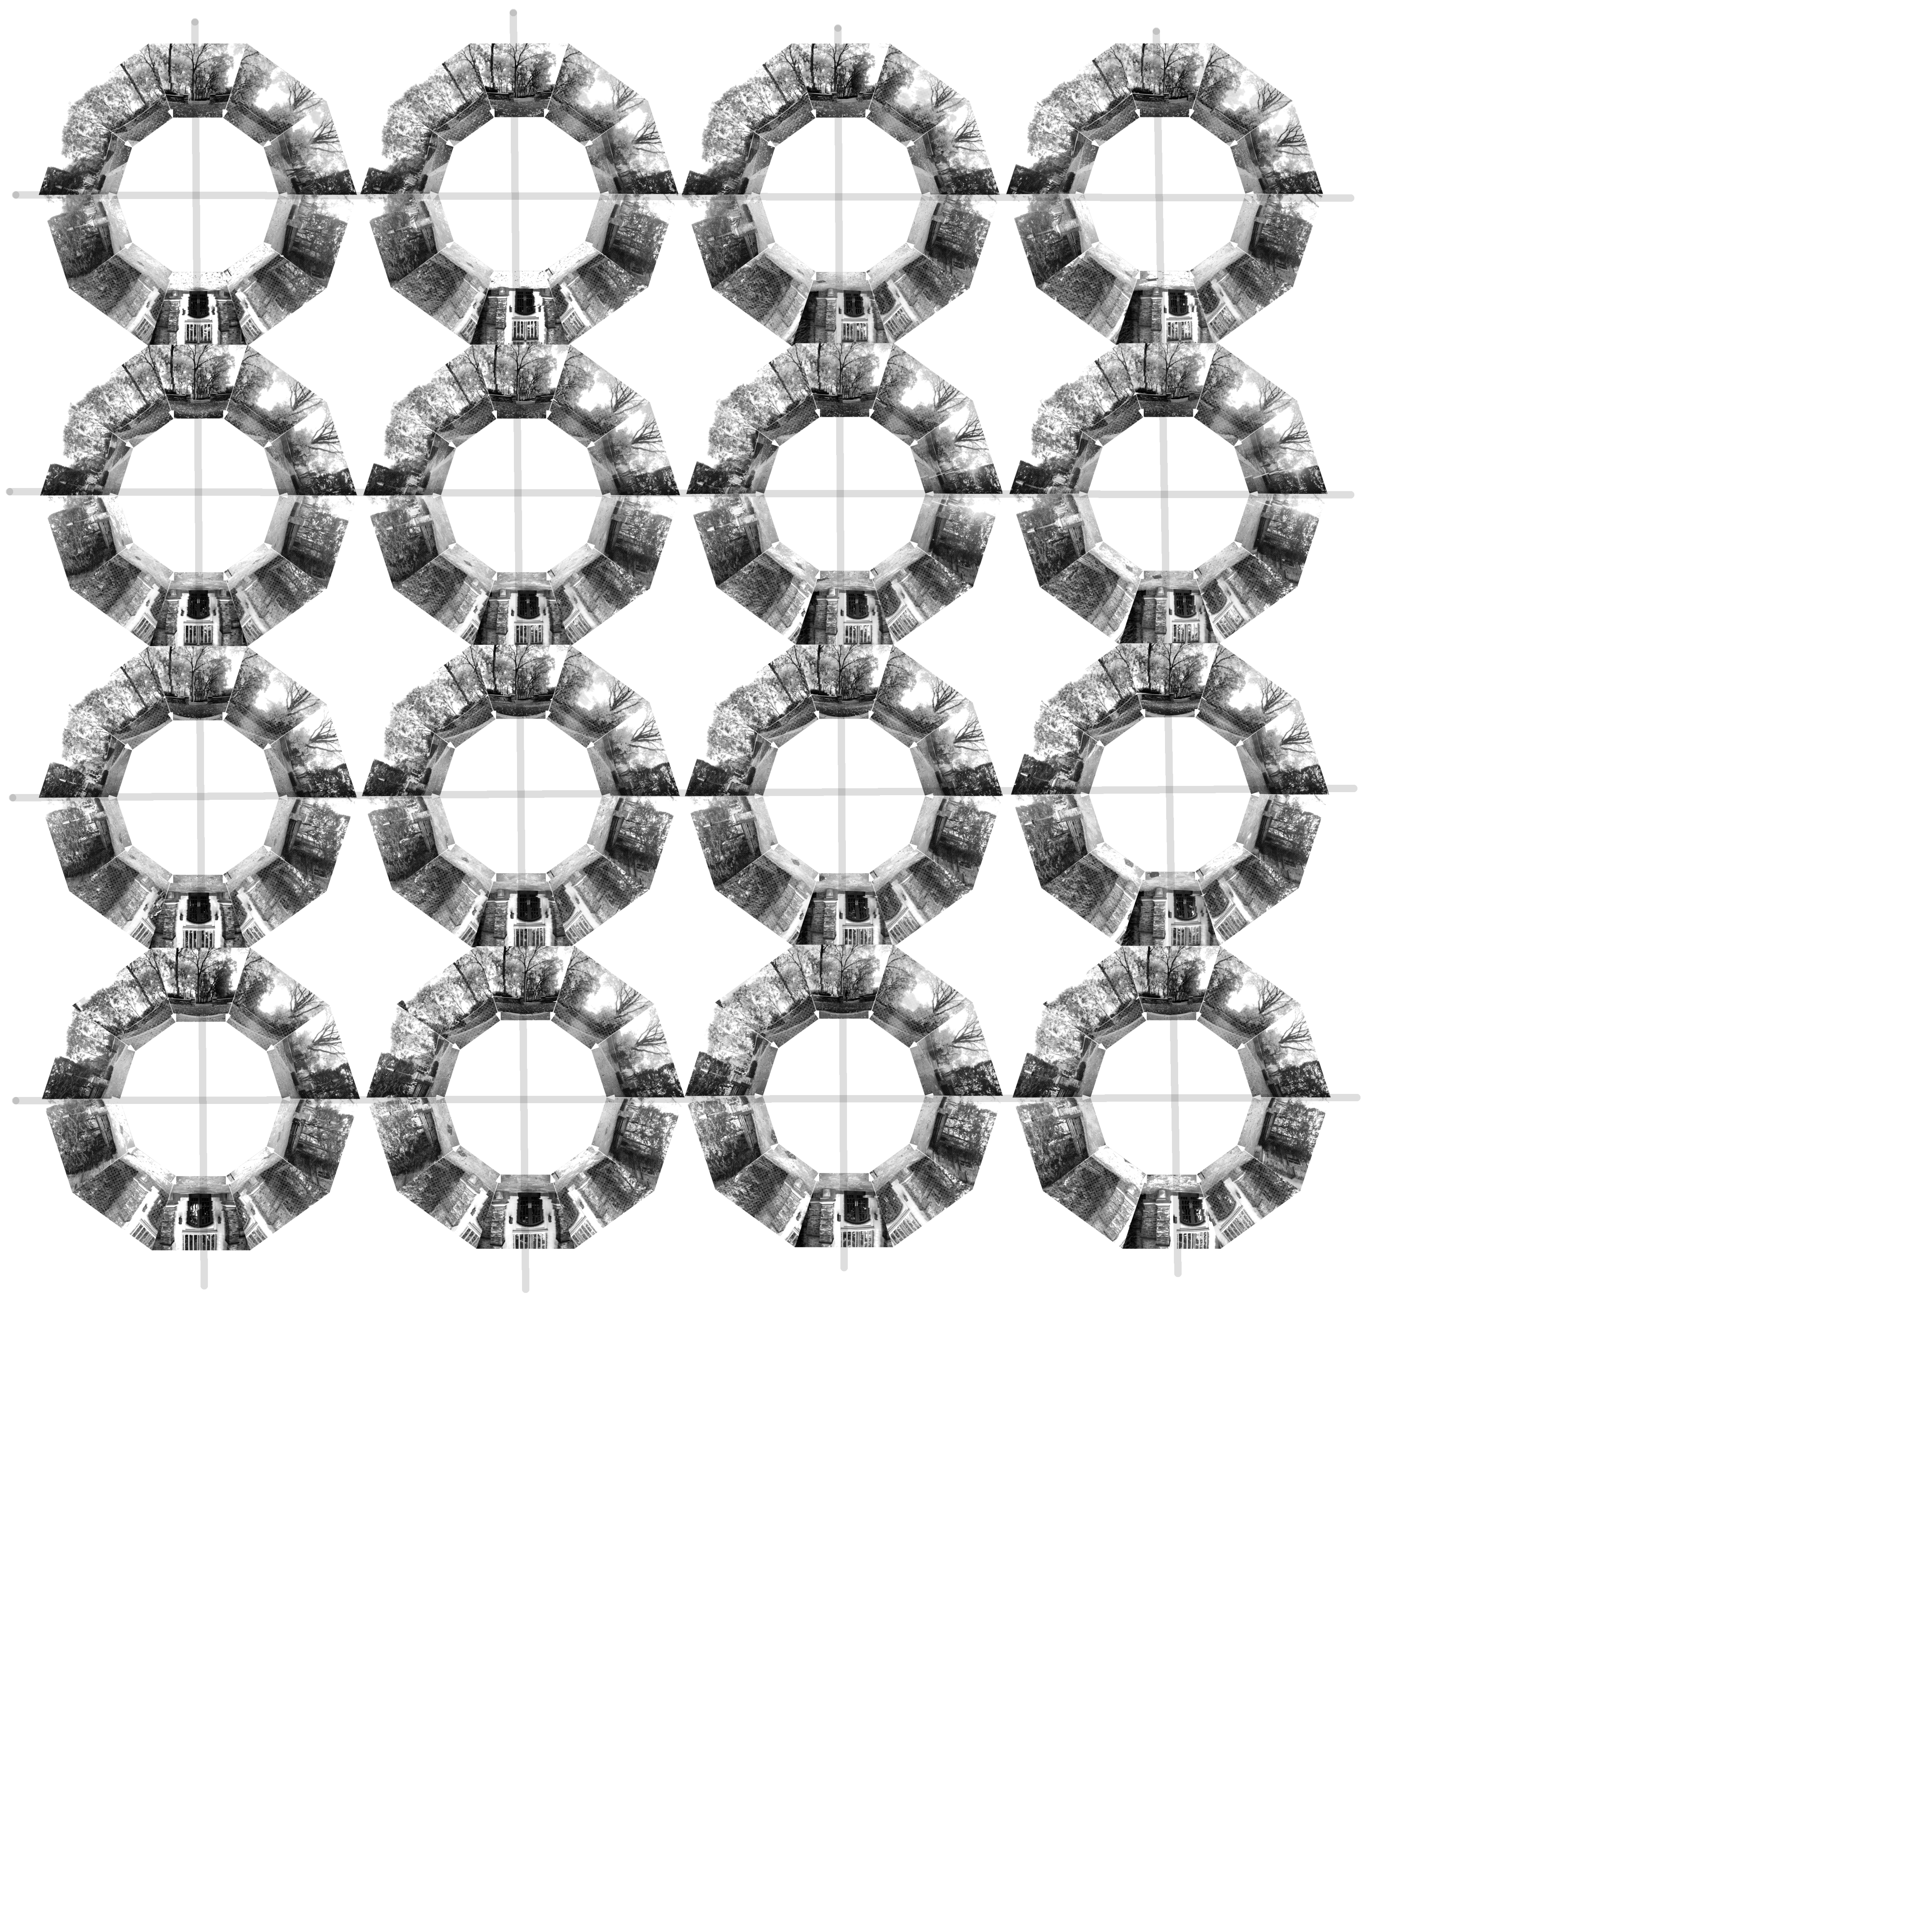
Figure 2: Grid of all 160 images for the G12 and G14 databases. Each grid cell shows the 10 visual images for that cell in the same format as Figure 1(a), and for each database the cells are arranged in the spatial order and orientation they were collected.
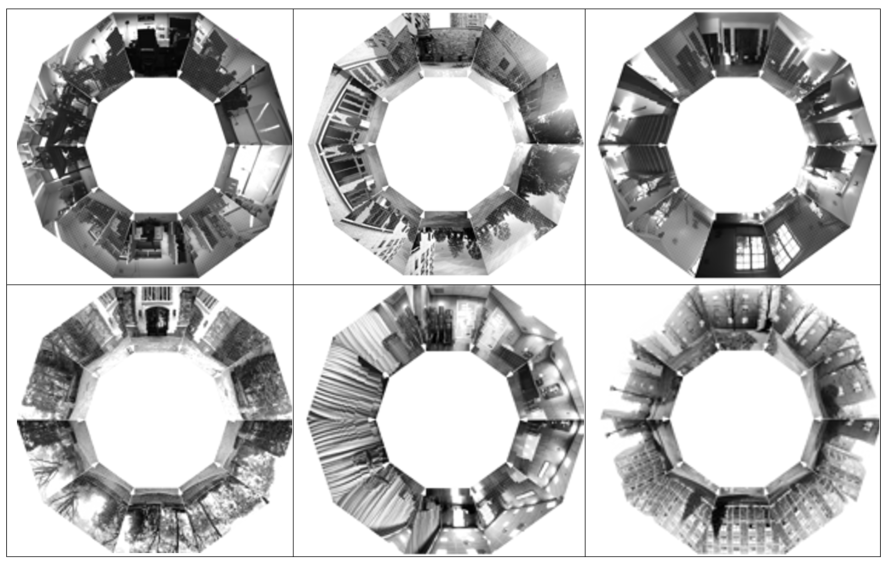
Figure 3: Set of all 10 visual images (displayed keystone warped only for display purposes) for a single cell from the G11 (top left) through G16 (bottom right)) databases respectively.
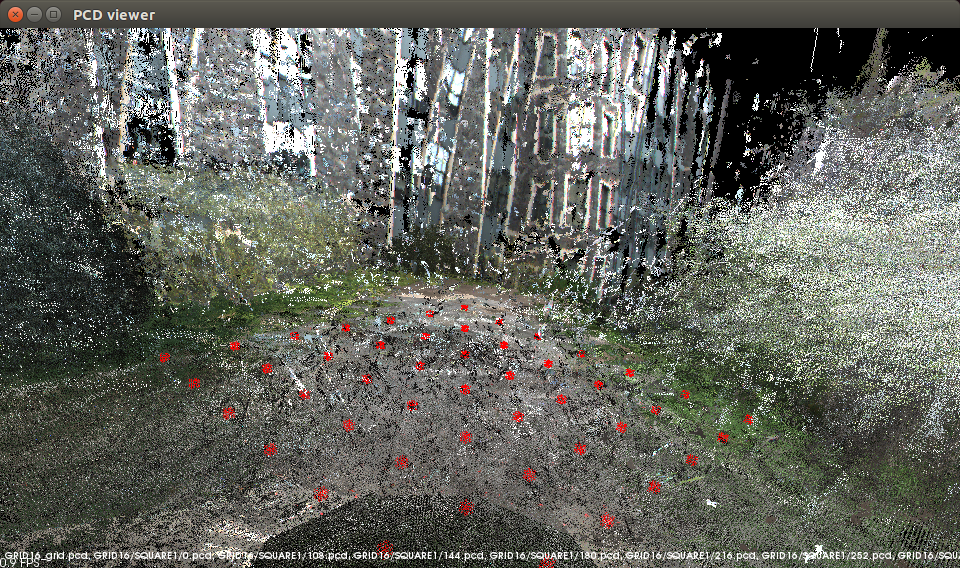
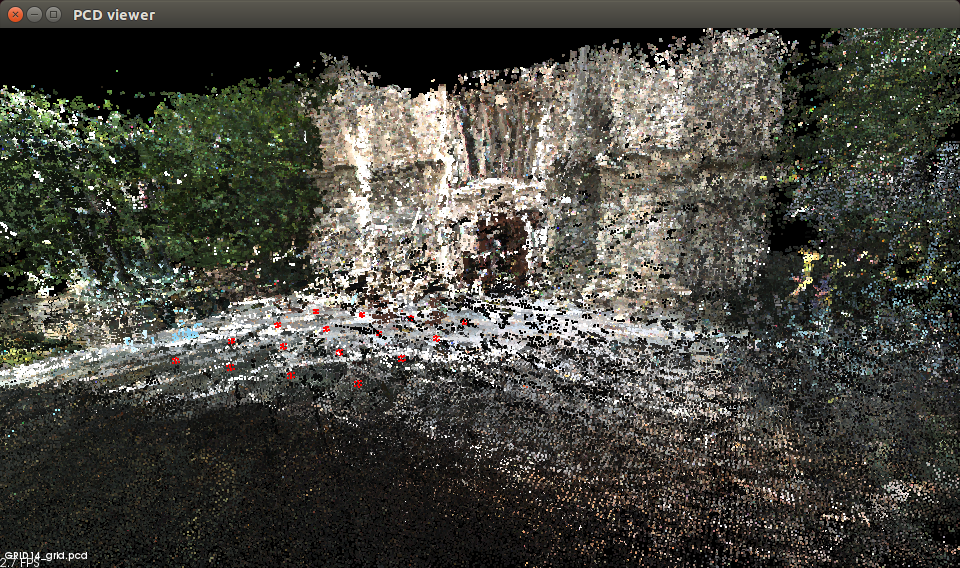
Figure 3.4: (left) A composite point cloud created from all 160 clouds (each in the form Figure 1(b)) of G14 and registered only using the spatial relationship of the grid; (right) shows this for the 490 clouds in G16. The grid of darker circles superimposed on the data in the foreground of each shows the grid vertices
A note on folder naming and orientation labeling orientation labeling
The depth files and the visual files are stored separately. For example, the depth files for G11 are stored in a folder called GRID11 with subfolders SQUARE1 through SQUARE16. The visual data for G11 is also stored in a folder called GRID11 with subfolders SQUARE1 through SQUARE16. So to download the the data, its best to make two folders Visual and Depth (for example) and download all the visual data to one and the depth to the others -- since the visual and depth folders for each database otherwise will have the same name! Each set of visual images for a cell is 7.5 MB in size and each set of depth images is 200 MB on average. In the Visual folder GRID11, subfolders SQUARE1 to SQUARE16, the images are labelled IMAGEnnn.pgm where nnn is 0, 36, 72, 108, 144, 180, 216, 252, 288, 324. These angles are with respect to the full positive pan angle, so 0 is actually 180 deg with respect to the X axis of the robot coordinate frame. In the Depth folder GRID11, subfolders SQUARE1 to SQUARE16, the images are labelled dataDump_nnn_mmm.txt and these are text files. Each line the text file has the entries:X,Y,Z are the 3D coordinates of the point with respect to the robot coordinate frame,
u,v are the image coordinates for the point (and used to register this point with the visual image)
d is the stereo disparity
r, g, b is the pixel color. The number is as follows: nn is 0, 36, 72, 108, 144, -144, -108, -72, -36 and where mm is 0 for all except one file which is nnn=-144 and mmm=-36 which marks the one rotation which the pan unit was at its max -144 and the robot based was rotated -36 to bring the robot to 180. The angle nnn in this case is with respect to the X axis of the robot coordinate frame. Its awkward that this is not the same labeling as for the visual data, and we will revise that in the next release. Histogram smoothing was performed on the visual images of all outdoor grids, in order to compensate for lighting conditions. A statistical filtering program, from the point cloud library, was executed on all stereo-depth files to clean up some stereo noise. The parameters of the point cloud statistical filter were a meanK of 50 and a standard deviation threshold of 0.2.
Datasets
The visual data
* grid11Image.tar.gz: Grid 11 4x4 grid image data.* grid12Image.tar.gz: Grid 12 4x4 grid, image data.
* grid13Image.tar.gz: Grid 13 4x4 grid, image data.
* grid14Image.tar.gz: Grid 14 4x4 grid, image data.
* grid15Image.tar.gz: Grid 14 7x7 grid, image data.
* grid16Image.tar.gz: Grid 16 7x7 grid, image data.
The depth data
* grid11Depth.tar.gz: Grid 11 4x4 grid depth data.* grid12Depth.tar.gz: Grid 12 4x4 grid, depth data.
* grid13Depth.tar.gz: Grid 13 4x4 grid, depth data.
* grid14Depth.tar.gz: Grid 14 4x4 grid, depth data.
* grid15Depth.tar.gz: Grid 14 7x7 grid, depth data.
* grid16Depth.tar.gz: Grid 16 7x7 grid, depth data. This data is provided for general use without any warranty or support. Please send any email questions to dlyons@fordham.edu, bbarriage@fordham.edu, and ldelsignore@fordham.edu. The short URL for this page is http://goo.gl/h3pU7Q
Permissions
* Persons/group who can change the page:<br /> * Set ALLOWTOPICCHANGE = FRCVRoboticsGroup -- (c) Fordham University Robotics and Computer Vision
| Evaluation of Field of View Width |
in Stereo-vision based Visual Homing


| I | Attachment | History | Action | Size |
Date | Who | Comment |
|---|---|---|---|---|---|---|---|
| |
figure3.jpg | r1 | manage | 253.4 K | 2017-05-31 - 21:00 | DamianLyons | |
| |
GRID15SQ1.png | r1 | manage | 310.0 K | 2017-05-31 - 20:45 | DamianLyons | |
| |
GRID14SQ1.png | r1 | manage | 858.2 K | 2017-05-31 - 20:45 | DamianLyons | |
| |
GRID14_ISO1.png | r1 | manage | 1025.5 K | 2017-05-31 - 20:45 | DamianLyons | |
| |
Six_Database_part_1.bmp | r1 | manage | 1165.9 K | 2017-05-31 - 16:55 | DamianLyons | |
| |
Six_Database_part_2.bmp | r1 | manage | 1165.9 K | 2017-05-31 - 16:56 | DamianLyons | |
| |
All_Six_Decagons.bmp | r1 | manage | 1459.9 K | 2017-05-31 - 20:45 | DamianLyons | |
| |
GRID16_ISO3.png | r1 | manage | 1511.2 K | 2017-05-31 - 20:44 | DamianLyons | |
| |
GRID12Lines.jpg | r1 | manage | 2814.8 K | 2017-05-31 - 21:08 | DamianLyons | |
| |
GRID14Lines.jpg | r1 | manage | 3069.8 K | 2017-05-31 - 21:08 | DamianLyons | |
| |
GRID12Lines.png | r1 | manage | 8243.1 K | 2017-05-31 - 20:44 | DamianLyons | |
| |
GRID14Lines.png | r1 | manage | 8870.6 K | 2017-05-31 - 20:44 | DamianLyons |
Topic revision: r5 - 2018-11-15 - DamianLyons

Ideas, requests, problems regarding TWiki? Send feedback